Self Contained Tutorial
In this tutorial you will:
Write some assembly
Assemble (compile) it
Add a bug
Run your code in a simulator
Debug the bug
Learn how to show important signals from the waveform
Fix the bug
Tooling
You have two options for getting started:
You can use the Docker image with all the dependencies preinstalled.
You can use the How To Use guide on how to install all the stuff you need locally on your machine.
Assembler
Looking at examples
In case you haven't done so, you should bring your repo up to speed and init+update all the submodules.
cd VexiiRiscv
git pull
git submodule update --init --recursive
After that you can find many test programs in ext/NaxSoftware/baremetal, mostly written in assembly. For instance :
simdAdd : is used to test a custom instruction which implements 4 bytes adder in a single instruction.
pmp : is used to test the RISC-V PMP, which allows the machine mode to restrict memory accesses of the supervisor/user mode to specific ranges (Physical Memory Protection).
machine_vexii : is used to test most of the RISC-V machine mode privileged spec, as for instance, unaligned memory load exception.
Writing tests in assembly is often the only viable way to test low level features for a few reasons :
It avoid all the noise which would come from C/C++ languages.
It allows to restrict the features of the CPU being used in the tests, which is very useful for bring-up.
It allows to create very precise sequences of instructions, allowing you to trigger specific corner cases.
Write the assembler code
So first of all, create a folder called "mytest" in your VexiiRiscv repository root ("/work" inside the Docker environment, or "VexiiRiscv" if you cloned the repository).
cd VexiiRiscv
mkdir -p mytest/src
cd mytest
or in Docker
cd /work
mkdir -p mytest/src
cd mytest
then create an assembler file inside the src folder called "crt.S" containing the following code:
.option arch, +zicsr

.global _start
_start:
  li x1, 42 // Write the literal value 42 in the integer register x1
Build the assembler code
Now, it's time to create a GNU make file, using the NaxSoftware infrastructure, so that we can turn our assembly code into a binary.
In the mytest folder, create a Makefile file containing the following:
PROJ_NAME=mytest
STANDALONE=../ext/NaxSoftware/baremetal
include ../ext/NaxSoftware/baremetal/common/asm.mk
After running make in your bash or Cygwin shell (assuming you have installed everything), you should now be able to find a folder named "build", containing a bin file, and asm file and most importantly the ELF and map file.
leviathan@harvey:~/VexiiRiscv/mytest> ls build/
mytest.asm  mytest.bin  mytest.elf  mytest.map
In short, here is what those files are for :
mytest.elf : This is the primary output of the compiler, it contains all the information about our compiled program such as instructions, data, and symbol locations. If you need to backup a compiled program, backup this file, as all the 3 other (bin/asm/map) files are generated from this elf.
mytest.bin : Raw binary file of your program. In our case, if this binary file was directly loaded in the memory at the reset vector of the CPU (0x80000000), we would be good to go.
mytest.asm : A text file which tells you every instruction contained in your compiled program, as well as their location in the memory space, which is quite useful when you debug the CPU itself.
mytest.map : Specify the memory location of every section/symbol/variable of your program. Not so useful in general, but can allow tracking the access to specific memory variables from a waveform.
Initial run (Error)
In order to run the assembly code we just made, we have to tell sbt to load our ELF file into the VexiiRiscv simulator by running the following command in the root source folder (Whether you use /work or VexiiRiscv paths in the following depends upon your environment):
cd ..
sbt "Test/runMain vexiiriscv.tester.TestBench --with-rvm --allow-bypass-from=0 --load-elf mytest/build/mytest.elf --trace-all"
Here are what the options are for :
--with-rvm : Will turn on the RISC-V RVM extensions, allowing the execution of mul/div instruction.
--allow-bypass-from=0 : Will enable the execute pipeline to forward results from the ALU back to new instruction before they committed, so you can execute ALU instruction back to back, even when they depend on each others.
--load-elf : This will ask the testbench to load the simulated memory with the content of the elf file before the CPU starts. Additionally, if the testbench detect that the CPU reached the pass/fail symbols of the elf file, it will end the simulation with a success/failure event.
--trace-all : This will ask the simulation to capture a whole set of simulation traces that you can find in simWorkspace/VexiiRiscv/test, including the simulation waveform (wave.fst), a representation of the CPU pipeline status (konata.log).
Keep in mind, by default, VexiiRiscv is configured with most of its features disabled, with no branch prediction, no cache, no mmu, for example.
Now it's running:
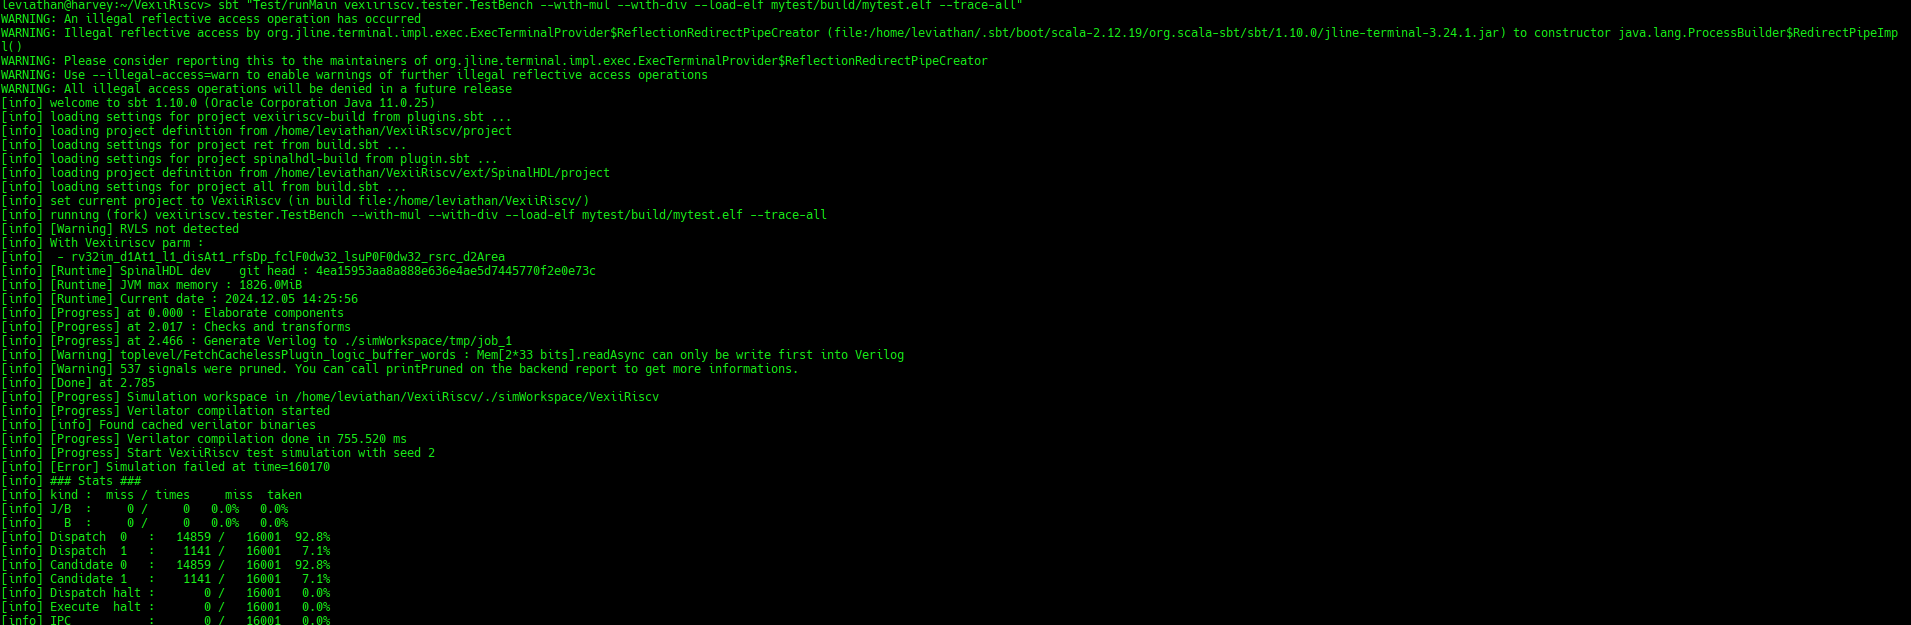
But... ooopsie. It failed.
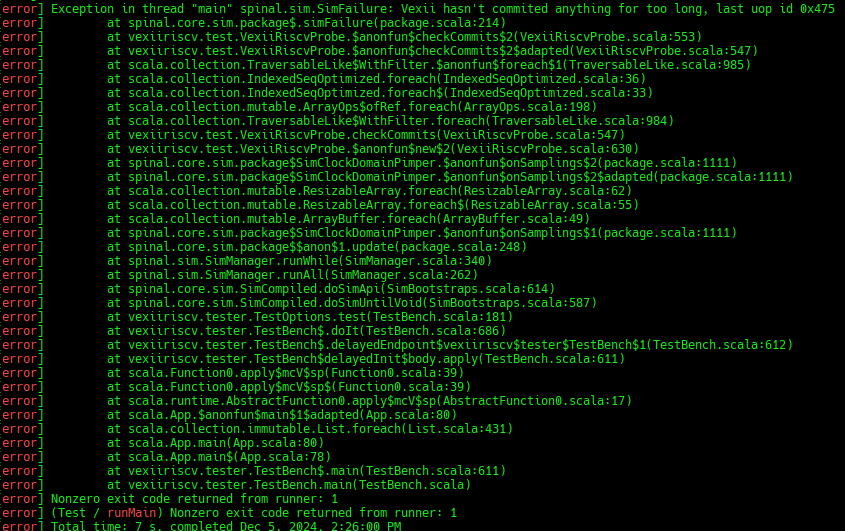
Question: Why??
Answer The CPU is locked into a illegal instruction exception loop of doom.
Here is the full scenario :
Once the CPU has executed li x1, 42, it will then reach a portion of memory which isn't loaded with code but instead has a random value (the testbench is designed that way).
So it is very likely that the CPU will try to execute a portion of memory which isn't recognized as an instruction, which produces a illegal instruction exception.
This results in the CPU jumping to its trap vector (mtvec).
This trap vector will be initialized by the CPU reset to 0, which will make the CPU jump/trap to PC=0
At PC=0 there will be some random values, which are likely to produce another illegal instruction exception, repeating forever.
The testbench should then detect that the CPU is no longer doing any commit (forward progress), and call it a failure.
Fixing the Error
We can fix this error quickly by adding these two additional lines to our assembler file:
pass:
  j pass
Which results in the following code
.option arch, +zicsr

.global _start
_start:
  li x1, 42 // Write the value 42 in the register x1
pass:
  j pass
After that we run the make/sbt command again.
Now the simulation won't fail anymore, and should exit gracefully, as the testbench will detect that the CPU reached the pass symbol.
However, an endless loop which doesn't anything isn't very useful.
Note, running SBT every time with sbt "Test/runMain vexiiriscv.tester.TestBench ... is slow and painful. What you can do instead is to simply run the sbt command without arguments, which will bring you into the SBT shell, from where you can run your Test/runMain vexiiriscv.tester.TestBench ... with much less overhead.
The assembler "hello world"
Since we can't really print out a "hello world" in this context because we're simulating a CPU and the execution of assembler code on it, we shall go for the next best thing: a "for" loop:
uint32_t sum = 0;

for(int i = 0; i < 5; i++) {
    sum = sum + i;
}
As RISC-V assembly this becomes the following:
.option arch, +zicsr

.global _start
_start:

    li a0, 0 # Initialize sum
    li t0, 0 # counter start value
    li t1, 5 # counter end value

sum_loop:
    bge t0, t1, pass # i == 5
    add a0, a0, t0
    addi t0, t0, 1
    j sum_loop

pass:
    j pass
Also, note that if you are interested into more C to assembly comparison, you can use the Compiler Explorer tool. Here is an example :
Note, you can see that this assembly example uses register names as a0, t1, while the previous example was using x1. RISC-V has two ways of naming the registers :
Via their raw name : x0, x1, x2, ..., x31
Via their ABI Mnemonic : zero, ra, sp, gp, tp, t0-t6, s0-s11, a0-a7
All of this is defined the RISC-V ABI register conventions (https://github.com/riscv-non-isa/riscv-elf-psabi-doc/blob/master/riscv-cc.adoc#register-convention), and GCC supports both. So, in general, if you write low level assembly tests, you can go for the raw name, otherwise just go with the ABI Mnemonic names.
Looking at the pipeline
Opening the pipeline trace (located in simWorkspace/VexiiRiscv/test/konata.log) using Konata , we can see that it goes five times through the loop.
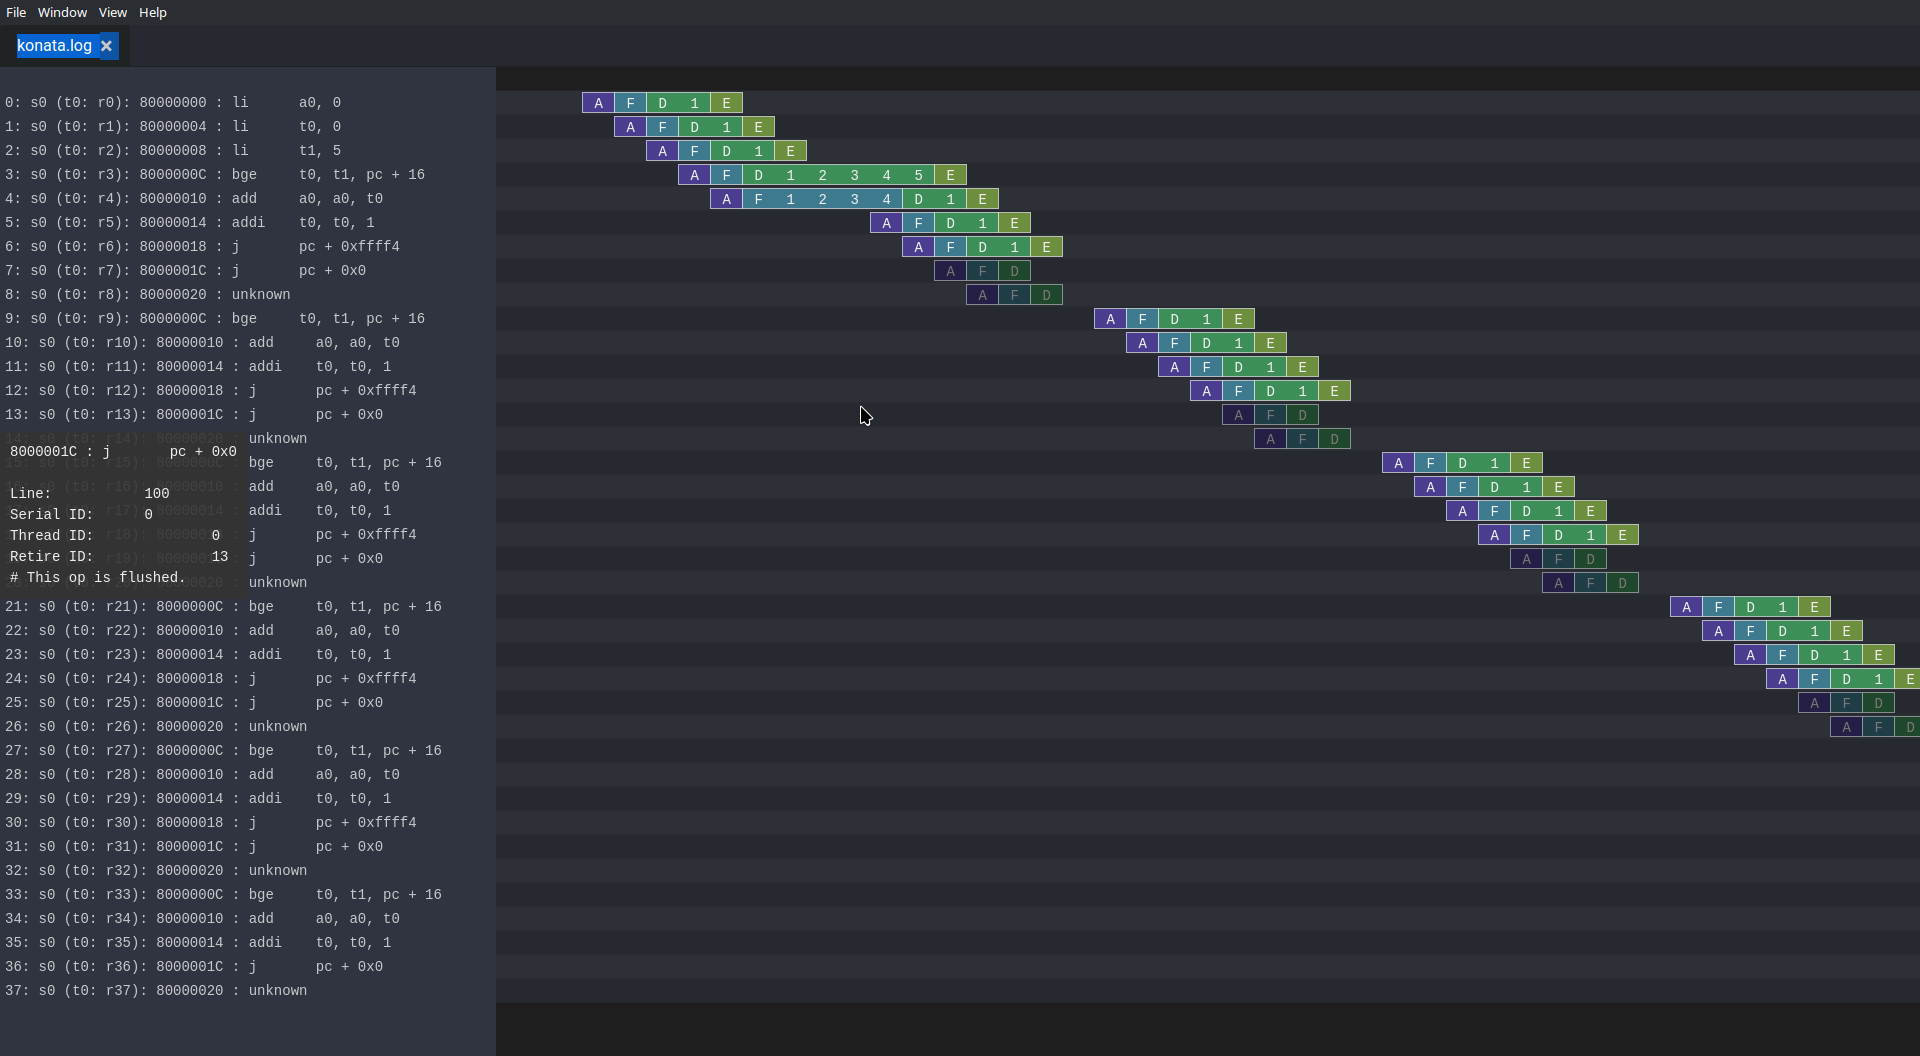
Here are a few explanations as to how to read those Konata traces :
The horizontal axis is the time axis
The vertical axis shows every instruction that reached the CPU decode stage (and further).
If on the left margin, you see some "???", it means that you need to compile the ext/riscv-isa-sim and ext/rvls. See ext/rvls/README.md
The reset vector of VexiiRiscv being by default 0x80000000, you can see on the top left where it starts.
the A/F/D/I/E symbols represent when a given instruction is in the FPU, and in which part.
A : Address generation of the instruction PC.
F : Fetch, when the CPU is reading the instruction from the memory (or its cache).
D : Decode/dispatch, when the CPU is figuring out what the instruction is about, wait until the time is right to schedule the instruction to the execute pipeline, and read the register file.
E : Execute, when the instruction is being processed.
Instructions in vivid colors are the ones which successfully executed (committed instructions).
Instructions in dark colors are the ones which failed to execute (for example : flushed by an un-predicted/miss-predicted branch/jump).
Our i < 5 condition should have been successfully executed.
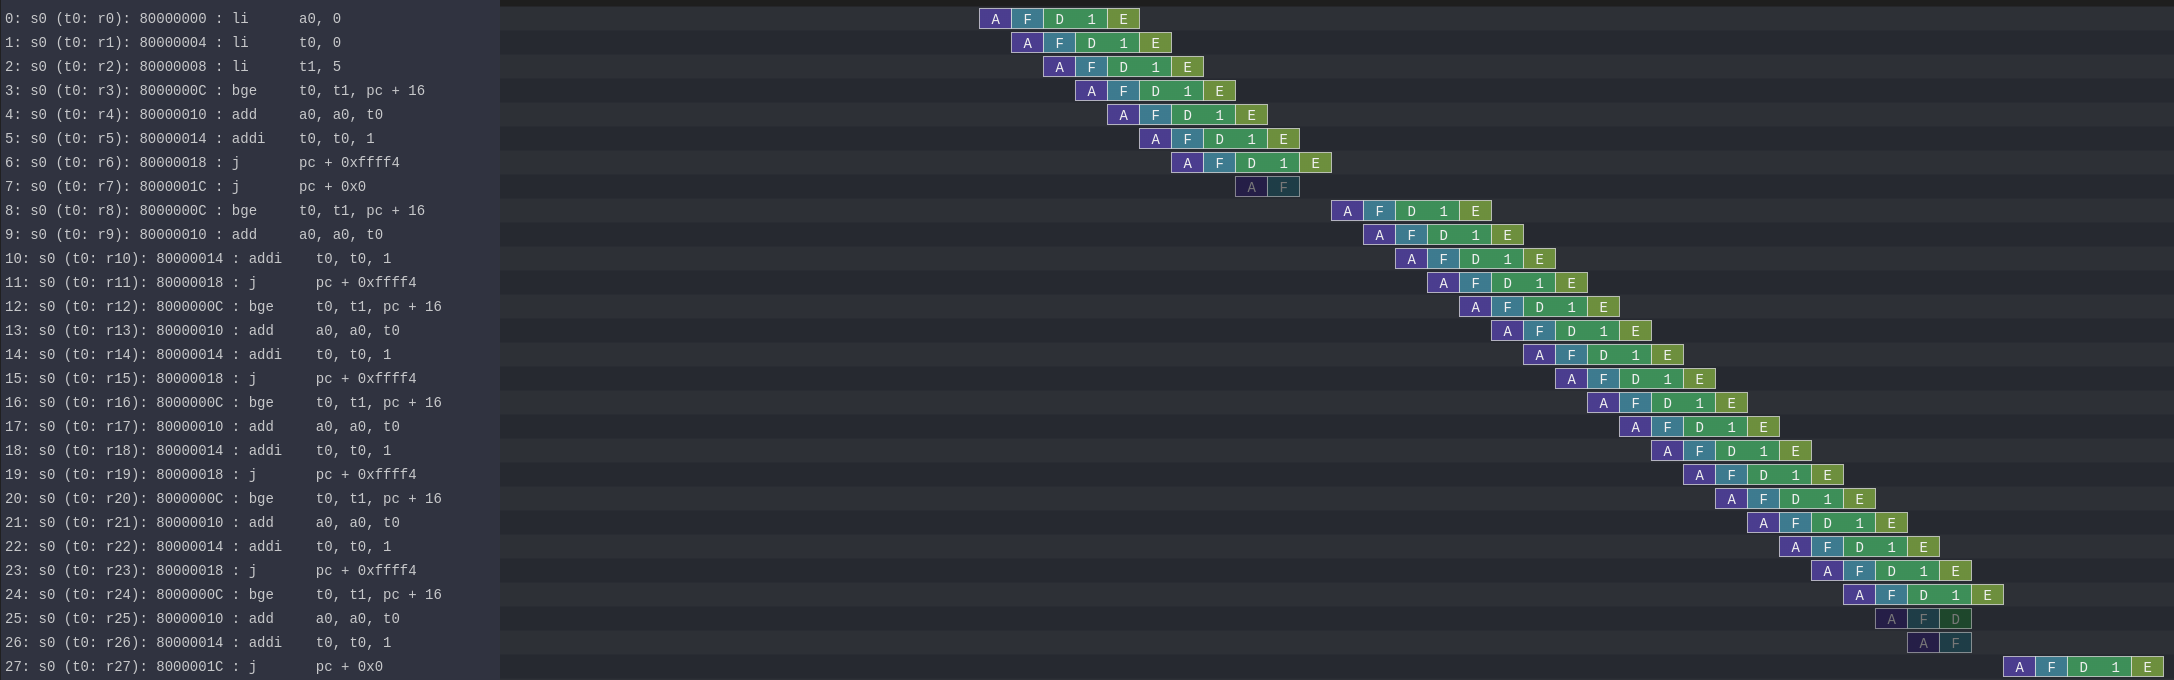
Enabling branch prediction
By default, the VexiiRiscv branch prediction feature is disabled. You can turn on a partial version of it on by adding --with-btb argument to your simulation command.
This will enable the Branch Target Buffer (BTB), which allows VexiiRiscv to predict a few things very early in the fetch pipeline, such as :
For a given PC, is the instruction a jump/branch ?
If it is, what would be its target PC ?
If it is a branch, is it likely to be taken ?
You can observe the effects of the branch prediction easily via the Konata trace :
Looking at the waveform
Opening the simulation waveform (located in simWorkspace/VexiiRiscv/test/wave.fst) using gtkwave, you can visualize every signal in the simulated CPU across the whole simulation.
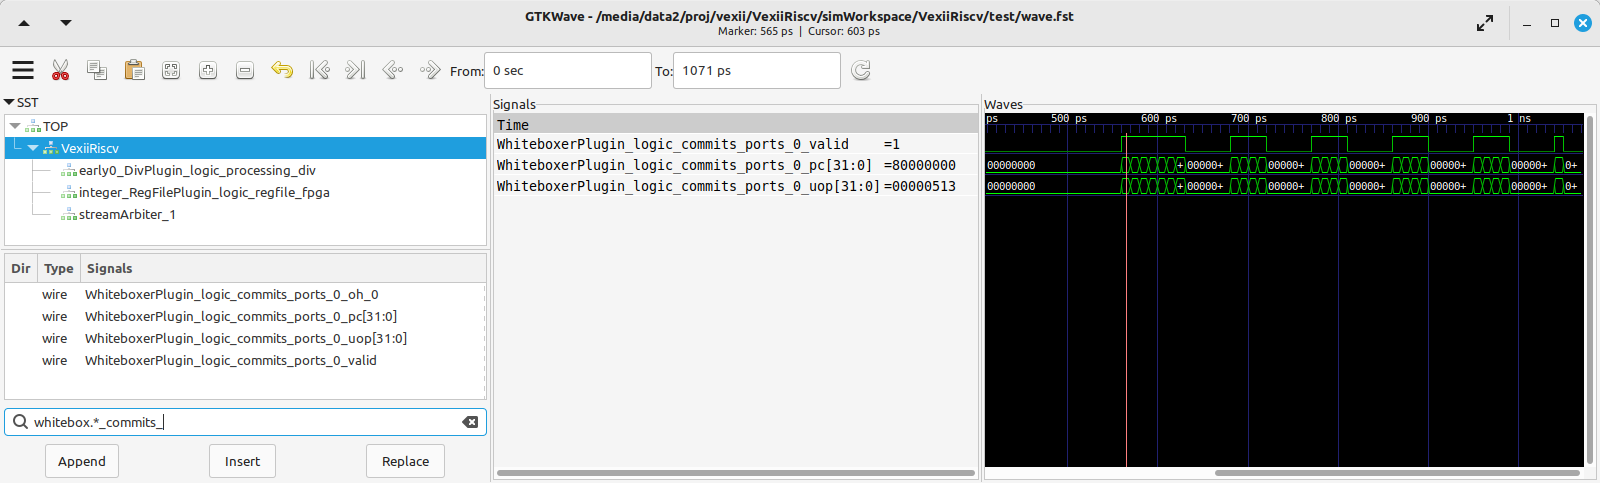
So here the difficulty comes in knowing what to look at in this ocean of wires. Here is a few tips about that.
The WhiteboxerPlugin collects many key events from the CPU for debug purposes, in particular its whiteboxerPlugin_logic_commits signals will tell you when the CPU commits an instruction.
DispatchPlugin_logic_candidates signals will tell you every instruction currently waiting to be dispatched to the execution pipeline, as well as their context.
There are a few pipeline signals as : fetch_logic_ctrl, and decode_ctrl execute_ctrl. Note that how to tell whether there is a transaction in a given pipeline varies between the pipelines. For the fetch, you can probe fetch.*ctrl.*_valid, while for decode it is decode.*LANE_SEL_.$, and for execute it is execute.*LANE_SEL_lane.$.
Introducing a bug
Let's say you want to change the way the integer ALU is implemented, the easiest way to do so would be to modify the IntAluPlugin.scala (https://github.com/SpinalHDL/VexiiRiscv/blob/977633e2866b0ab0ffbfc402b459803e2b6f8a0a/src/main/scala/vexiiriscv/execute/IntAluPlugin.scala#L72)
Let's corrupt the XOR instruction to behave like a bitwise OR :
AluBitwiseCtrlEnum.XOR  -> (srcp.SRC1 ^ srcp.SRC2),
//into
AluBitwiseCtrlEnum.XOR  -> (srcp.SRC1 | srcp.SRC2),
Then let's run this assembly code in the simulation :
.option arch, +zicsr

.global _start
_start:
    li x1, 0x0101 // First operand
    li x2, 0x1100 // Second operand
    li x3, 0x0110 // Expected result for a xor
    xor x4, x1, x2
    bne x4, x3, fail
pass:
    j pass
fail:
    j fail
You can now compile the test and run it in the simulator, then, if you have ext/riscv-isa-sim and ext/rvls compiled, you should get the following testbench failure (as it should) :
[Progress] Start VexiiRiscv test simulation with seed 2
[Error] Simulation failed at time=600
### Stats ###
kind :  miss / times     miss  taken
J/B  :     0 /     0   0.0%   0.0%
  B  :     0 /     0   0.0%   0.0%
Dispatch  0   :      36 /      44  81.8%
Dispatch  1   :       7 /      44  15.9%
Candidate 0   :      36 /      44  81.8%
Candidate 1   :       7 /      44  15.9%
Dispatch halt :       0 /      44   0.0%
Execute  halt :       0 /      44   0.0%
IPC           :       6 /      44  13.6%

Exception in thread "main" java.lang.Exception: INTEGER WRITE MISSMATCH DUT=1110 REF=110
So, the interesting thing here is that the testbench didn't fail because we reached the fail symbol, but instead because the testbench checks what is happening on every instruction committed by the CPU, and detected some bad behavior. It does this by running RVLS as a golden reference, in a lockstep manner with the simulated VexiiRiscv. This way, as soon as any hardware bug appears in VexiiRiscv, it is automatically caught by the testbench, and reported as an error. In our case, it detected that the register file was written with 0x1110 by VexiiRiscv (Device Under Test), instead of 0x0110 by RVLS (Reference).
In other words, you don't need to check that the xor instruction is executing properly by adding assembly code (bne x4, x3, fail), just executing the instruction is enough :D. This is very very useful when you run for instance a simulation of VexiiRiscv booting linux. This takes a lot of time (~20mn), and if the CPU is misbehaving, without this lock-step checking it would be very very hard to spot when things went bad for a few reasons :
CPU bugs may not make the software crash instantly, or at all. Symptoms and causes can be very far apart (in time).
Long simulation (ex booting linux) are about 400'000'000 cycles long, such that it becomes impossible to save all of it in a wave, as that is way too much data.
Note, if you look into simWorkspace/VexiiRiscv/test/spike.log, you can see the riscv-isa-sim logs, which gives a better insight about what was expected :
core   0: 0x80000000 (0x000010b7) lui     ra, 0x1
core   0: 3 0x80000000 (0x000010b7) x 1 0x00001000
core   0: 0x80000004 (0x01008093) addi    ra, ra, 16
core   0: 3 0x80000004 (0x01008093) x 1 0x00001010
core   0: 0x80000008 (0x00001137) lui     sp, 0x1
core   0: 3 0x80000008 (0x00001137) x 2 0x00001000
core   0: 0x8000000c (0x10010113) addi    sp, sp, 256
core   0: 3 0x8000000c (0x10010113) x 2 0x00001100
core   0: 0x80000010 (0x11000193) li      gp, 272
core   0: 3 0x80000010 (0x11000193) x 3 0x00000110
core   0: 0x80000014 (0x0020c233) xor     tp, ra, sp
core   0: 3 0x80000014 (0x0020c233) x 4 0x00000110
Experimenting with privilege levels
The RISC-V privilege specification specifies 3 levels in which the CPU can be when it executes code :
Machine mode : This is the privilege level which can access everything. When the CPU comes out of reset, it spawns in machine mode. Typically, machine mode will be used to run bootloaders, bios, and baremetal applications.
Supervisor mode : This is the privileged mode which would be used to run operating systems or kernels which want to take advantage of the RISC-V MMU.
User mode : Operating systems or kernels will typically use the user mode to run applications. You can see user mode as a sandbox to prevent applications from doing harm.
So, the RISC-V privilege specification is very hard to read if you don't already have some good knowledge about what to expect. What this example aims at is to show you how you can navigate your CPU between privilege modes.
.option arch, +zicsr

.global _start
_start:
#define MSTATUS_MPP_SUPERVISOR         0x00000800
#define MSTATUS_MPP_USER               0x00000000
#define CAUSE_ILLEGAL_INSTRUCTION 2

    // Specify where the CPU should jump after executing the mret instruction
    la x1, supervisor_entry; csrw mepc, x1
    // Specify where the CPU should jump when it got a interruption/exception for the machine mode
    la x1, supervisor_exit; csrw mtvec, x1
    // Specify that the CPU should go in supervisor mode after executing the mret instruction
    li x1, MSTATUS_MPP_SUPERVISOR; csrw mstatus, x1
    // Engage the privilege transition.
    mret

    // The CPU should never reach this point
    j fail

supervisor_entry:
    //Welcome in supervisor mode :D
    li x1, 666
    // let's run a illegal instruction, we aren't allowed to access machine mode CSR from supervisor mode !
    csrr x1, mepc
    // We should not be able to reach this point, as the previous instruction would have produce a illegal instruction exception
    j fail

supervisor_exit:
    // Welcome back in machine mode :D
    li x1, 42
    // let's read the CSR which indicate the reason why we back to machine mode, and check it is because of CAUSE_ILLEGAL_INSTRUCTION
    csrr x1, mcause
    li x2, CAUSE_ILLEGAL_INSTRUCTION; bne x1, x2, fail
    // let's read which instruction (PC) caused it
    csrr x1, mcause

pass:
    j pass
fail:
    j fail
Compile it, but to run it in the simulation you will need to add the --with-supervisor, as the VexiiRiscv only supports machine mode by default.
Here is a wave with a few key signals to figure out what the CPU is doing :
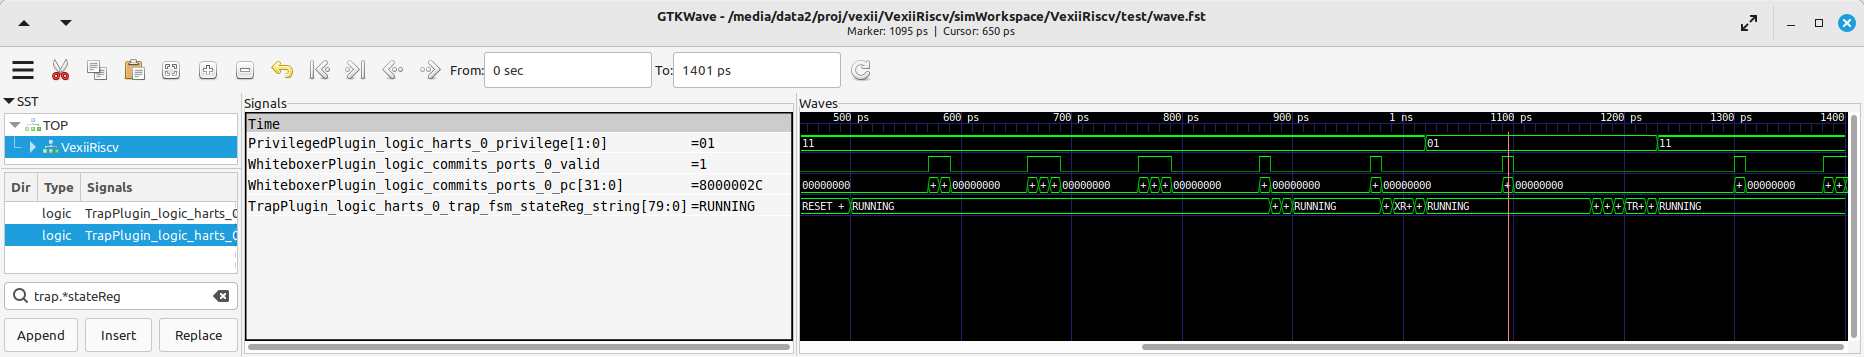
Note the TrapPlugin_logic_harts_0_trap_fsm_stateReg_string signal, which is a special state machine in VexiiRiscv which is used to handle a few corner cases as interrupts, exceptions, replays of failed instructions, and a few other things.
Also, note that ext/NaxSoftware/baremetal/driver/privileged.h contains a bunch of very useful macros to do similar things.
Connecting with openocd to the simulation
Openocd is a tool generally used to connect your PC to a micro-controller and debug/reprogram it through a USB to JTAG dongle.
One interesting thing is that there are ways to simulate that jtag connection between openocd and the VexiiRiscv simulation by using a TCP connection. Here is how you can do it :
First, install openocd (a regular version should be fine).
Then, let a simulation run in one terminal with the following additional arguments --no-probe --no-rvls-check --debug-privileged --debug-jtag-tap --jtag-remote. Do not forget to remove the --trace-all, as it will create very big log files if you let it run for a long time, as well as slowing down the simulation.
--no-probe : Will disable the testbench CPU inactivity watchdog (as we can stop the CPU activity totally using the jtag).
--no-rvls-check : Will disable the RVLS golden model checking, as it isn't supported with the jtag connection yet.
--debug-privileged : Will enable the CPU debug interface as well as all the required special CSR (Control Status Register).
--debug-jtag-tap : Will add to the CPU all the required logic to drive the CPU debug interface from a JTAG interface.
--jtag-remote : Will ask the testbench to implement the TCP to simulated JTAG bridge.
Then you can start openocd via :
(cd src/main/tcl/openocd/ && openocd -f vexiiriscv_sim.tcl)
This should give you the following message :
rawrr@rawrr-pc:/media/data2/proj/vexii/VexiiRiscv$ (cd src/main/tcl/openocd/ && openocd -f vexiiriscv_sim.tcl)
Open On-Chip Debugger 0.11.0
Licensed under GNU GPL v2
For bug reports, read
        http://openocd.org/doc/doxygen/bugs.html
Info : only one transport option; autoselect 'jtag'
Info : set servers polling period to 400ms
Info : Initializing remote_bitbang driver
Info : Connecting to localhost:44853
Info : remote_bitbang driver initialized
Info : This adapter doesn't support configurable speed
Info : JTAG tap: riscv.cpu tap/device found: 0x10002fff (mfg: 0x7ff (<invalid>), part: 0x0002, ver: 0x1)
Info : datacount=1 progbufsize=2
Info : Disabling abstract command reads from CSRs.
Info : Examined RISC-V core; found 1 harts
Info :  hart 0: XLEN=32, misa=0x40000100
Info : starting gdb server for riscv.cpu.0 on 3333
Info : Listening on port 3333 for gdb connections
Ready for Remote Connections
Info : Listening on port 6666 for tcl connections
Info : Listening on port 4444 for telnet connections
Meaning that the connection is successful!
You can then connect to openocd in a few ways :
Using GDB, which would allow you to have a fully fledge debugger
Using telnet, to ask openocd to execute basic commands.
The issue with GDB, for very low level debugging, is that it often has a lot of overhead/noise even for simple tasks. So in general using telnet is a better first step.
Here is an example of telnet connection to openocd :
telnet localhost 4444
Trying 127.0.0.1...
Connected to localhost.
Escape character is '^]'.
Open On-Chip Debugger
>
Then you can run various commands as :
# Read a 32 bits word at the address 0x80000000
mdw 0x80000000

# Write a 32 bits word (0x04200513, which is a "li a0, 0x42" instruction) at the address 0x80000000
mww 0x80000000 0x04200513

# Move the CPU PC to the instruction we just wrote at 0x80000000
reg pc 0x80000000

# Ask the CPU to execute a single instruction
step

# Read the CPU PC, it should be 0x80000004
reg pc

# Read the CPU register a0, it should be 0x42 (just written by the instruction we step)
reg a0
There are plenty of other commands available. For instance you could load the opensbi, device tree, linux, and buildroot binary files in the memory from the JTAG, and boot linux, all from the JTAG! (maybe not in simulation, it would take too long to load the images :D)
C code "hello world" (literally)
Here's a simple example how you can use C and sim_putchar for printing out directly through the simulation environment, allowing you to output debug messages from within the firmware you're developing.
Write the C code
So first of all, create a folder called "mytest" in your VexiiRiscv repository root ("/work" inside the Docker environment, or "VexiiRiscv" if you cloned the repository).
cd VexiiRiscv
mkdir -p helloworld/src
cd helloworld
or in Docker
cd /work
mkdir -p helloworld/src
cd helloworld
Create a file in src, called main.c
The content of src/main.c should look like this:
#include <sim.h>

void main(){
    for(int i=0;i<10;i++) {
        char *str = "hello world";
        while(*str) sim_putchar(*str++);
    }
}
Compiling the Code
Now, it's time to create a GNU make file using the NaxSoftware infrastructure, so that we can turn our C code into an ELF file which we can load in the simulator.
In the same helloworld folder as above, create a Makefile file containing the following:
PROJ_NAME=helloworld
STANDALONE=../ext/NaxSoftware/baremetal
SRCS =  $(wildcard src/*.c) \
        $(wildcard src/*.cpp) \
        $(wildcard src/*.S) \
        ${STANDALONE}/common/start.S
include ../ext/NaxSoftware/baremetal/common/app.mk
After running make in your bash shell or Cygwin shell depending upon your environment (assuming you have installed everything), you should now be able to find a folder named "build", containing a bin file, an asm file, and most importantly the ELF and map files.
leviathan@harvey:~/VexiiRiscv/helloworld> make
CC src/main.c
CC ../ext/NaxSoftware/baremetal/common/start.S
LD helloworld
/opt/riscv/lib/gcc/riscv64-unknown-elf/13.2.0/../../../../riscv64-unknown-elf/bin/ld: warning: build/helloworld.elf has a LOAD segment with RWX permissions
Memory region         Used Size  Region Size  %age Used
             ram:        4848 B       256 KB      1.85%
leviathan@harvey:~/VexiiRiscv/helloworld> ls
build  Makefile  src
leviathan@harvey:~/VexiiRiscv/helloworld> ls build/
helloworld.asm  helloworld.bin  helloworld.elf  helloworld.map  home
Compilation error
This might result in a compilation error, somewhat like this:
leviathan@harvey:~/VexiiRiscv/helloworld> make
CC src/fix.S
CC ../ext/NaxSoftware/baremetal/common/start.S
../ext/NaxSoftware/baremetal/common/start.S: Assembler messages:
../ext/NaxSoftware/baremetal/common/start.S:55: Error: unrecognized opcode `csrc mstatus,x1', extension `zicsr' required
../ext/NaxSoftware/baremetal/common/start.S:57: Error: unrecognized opcode `csrs mstatus,x1', extension `zicsr' required
This happens because newer builds of the RISC-V toolchain have this feature disabled by default, thus you will have to manually enable it. This can easily be achieved by adding the following on line 1 of ext/NaxSoftware/baremetal/common/start.S .
.option arch, +zicsr
...
Running the code
You can now use SBT in order to run the elf file in your simulation:
cd ..
sbt "Test/runMain vexiiriscv.tester.TestBench --with-rvm --allow-bypass-from=0 --load-elf helloworld/build/helloworld.elf --trace-all --no-probe --debug-privileged --no-rvls-check"
This should now print "hello world" 10 times on your terminal.
leviathan@harvey:~/VexiiRiscv> sbt "Test/runMain vexiiriscv.tester.TestBench --with-rvm --allow-bypass-from=0 --load-elf helloworld/build/helloworld.elf --trace-all --no-probe --debug-privileged --no-rvls-check"
WARNING: An illegal reflective access operation has occurred
WARNING: Illegal reflective access by org.jline.terminal.impl.exec.ExecTerminalProvider$ReflectionRedirectPipeCreator (file:/home/leviathan/.sbt/boot/scala-2.12.19/org.scala-sbt/sbt/1.10.0/jline-terminal-3.24.1.jar) to constructor java.lang.ProcessBuilder$RedirectPipeImpl()
WARNING: Please consider reporting this to the maintainers of org.jline.terminal.impl.exec.ExecTerminalProvider$ReflectionRedirectPipeCreator
WARNING: Use --illegal-access=warn to enable warnings of further illegal reflective access operations
WARNING: All illegal access operations will be denied in a future release
[info] welcome to sbt 1.10.0 (Oracle Corporation Java 11.0.25)
[info] loading settings for project vexiiriscv-build from plugins.sbt ...
[info] loading project definition from /home/leviathan/VexiiRiscv/project
[info] loading settings for project ret from build.sbt ...
[info] loading settings for project spinalhdl-build from plugin.sbt ...
[info] loading project definition from /home/leviathan/VexiiRiscv/ext/SpinalHDL/project
[info] loading settings for project all from build.sbt ...
[info] set current project to VexiiRiscv (in build file:/home/leviathan/VexiiRiscv/)
[info] running (fork) vexiiriscv.tester.TestBench --with-rvm --allow-bypass-from=0 --load-elf helloworld/build/helloworld.elf --trace-all --no-probe --debug-privileged --no-rvls-check
[info] With Vexiiriscv parm :
[info]  - rv32im_d1At1_l1_disAt1_rfsDp_fclF0dw32_lsuP0F0dw32_bp0_rsrc_d2Area_pdbg
[info] [Runtime] SpinalHDL dev    git head : 4ea15953aa8a888e636e4ae5d7445770f2e0e73c
[info] [Runtime] JVM max memory : 1826.0MiB
[info] [Runtime] Current date : 2024.12.05 20:01:11
[info] [Progress] at 0.000 : Elaborate components
[info] [Progress] at 1.790 : Checks and transforms
[info] [Progress] at 2.290 : Generate Verilog to ./simWorkspace/tmp/job_1
[info] [Warning] toplevel/FetchCachelessPlugin_logic_buffer_words : Mem[2*33 bits].readAsync can only be write first into Verilog
[info] [Warning] 546 signals were pruned. You can call printPruned on the backend report to get more informations.
[info] [Done] at 2.555
[info] [Progress] Simulation workspace in /home/leviathan/VexiiRiscv/./simWorkspace/VexiiRiscv
[info] [Progress] Verilator compilation started
[info] [info] Found cached verilator binaries
[info] [Progress] Verilator compilation done in 632.813 ms
[info] [Progress] Start VexiiRiscv test simulation with seed 2
[info] hello world
[info] hello world
[info] hello world
[info] hello world
[info] hello world
[info] hello world
[info] hello world
[info] hello world
[info] hello world
[info] hello world
Reading a CSR
In the CPU there is the mcycle CSR, which is a hardware counter which increments with every clock cycle. Let's say we want to print its value 10 times.
Reading a CSR (Control Status Register) in assembly is straightforward (ex : csrr x1, mstatus). But to do that in C, it's necessary to wrap it a bit.
#include <sim.h>
void main(){
    for(int i=0;i<10;i++) {
        int value;
        asm volatile ("csrr %0,  mcycle": "=r" (value));
        sim_puthex(value);
        sim_putchar('\n');
    }
}
Here are a few explanations :
asm : To start specifying some assembly inside some C code.
volatile : To ensure GCC do not optimize away the given assembly code (not realy necessary in our case).
"csrr %0, mcycle" : Read the mcycle CSR and write its value into %0, %0 refering to the value variable.
"=r" (value) : Define a write only output operand bound to the C "value" variable.
Here is not the place to go more into the details of the GCC asm("") syntax, as it is quite complicated.
Hopefully, there is the riscv.h header you can include, which wraps all of those asm("") commands into easy to use macros :
#include <sim.h>
#include <riscv.h>

void main(){
    for(int i=0;i<10;i++) {
        sim_puthex(csr_read(mcycle));
        sim_putchar('\n');
    }
}
Then, running it via :
sbt "Test/runMain vexiiriscv.tester.TestBench --with-rvm --allow-bypass-from=0 --load-elf helloworld/build/helloworld.elf --trace-all --no-probe --debug-privileged --no-rvls-check --performance-counters=0"
Will print the following in the terminal:
[info] [Progress] Start VexiiRiscv test simulation with seed 2
[info] 00000094
[info] 000000a6
[info] 000000b8
[info] 000000ca
[info] 000000dc
[info] 000000ee
[info] 00000100
[info] 00000112
[info] 00000124
[info] 00000136
Note, we added the --performance-counters=0 VexiiRiscv argument, as the mcycle isn't implemented otherwise. The RISC-V architecture specifies various 64 bit counters which aren't cheap in FPGA, so VexiiRiscv does not implement them by default.
Note, there are some cycles overhead to execute a CSR instruction :
In VexiiRiscv, the instruction dispatcher will wait until the execute pipeline is empty before dispatching a CSR access.
In VexiiRiscv, the CSR access themselves are executed inside a little state machine which takes a few cycles to decode, read, and write the CSR instruction.
In VexiiRiscv, all the performance counters as well as mcycle/minstret CSR are implemented using shared memory (to save area). Accessing that memory takes a few cycles.